How to Count People in Zones with YOLO26 and OpenCV (A Practical Walkthrough)
If you've ever stood in a crowded elevator and wondered "how many people can actually fit in here?", you've already grasped the problem this little script solves. Counting people is easy when you only care about the whole frame. It gets interesting the moment you want to know how many people are standing in a specific region — a doorway, a queue, a parking bay, or, in this case, the stacked floor areas of an elevator.
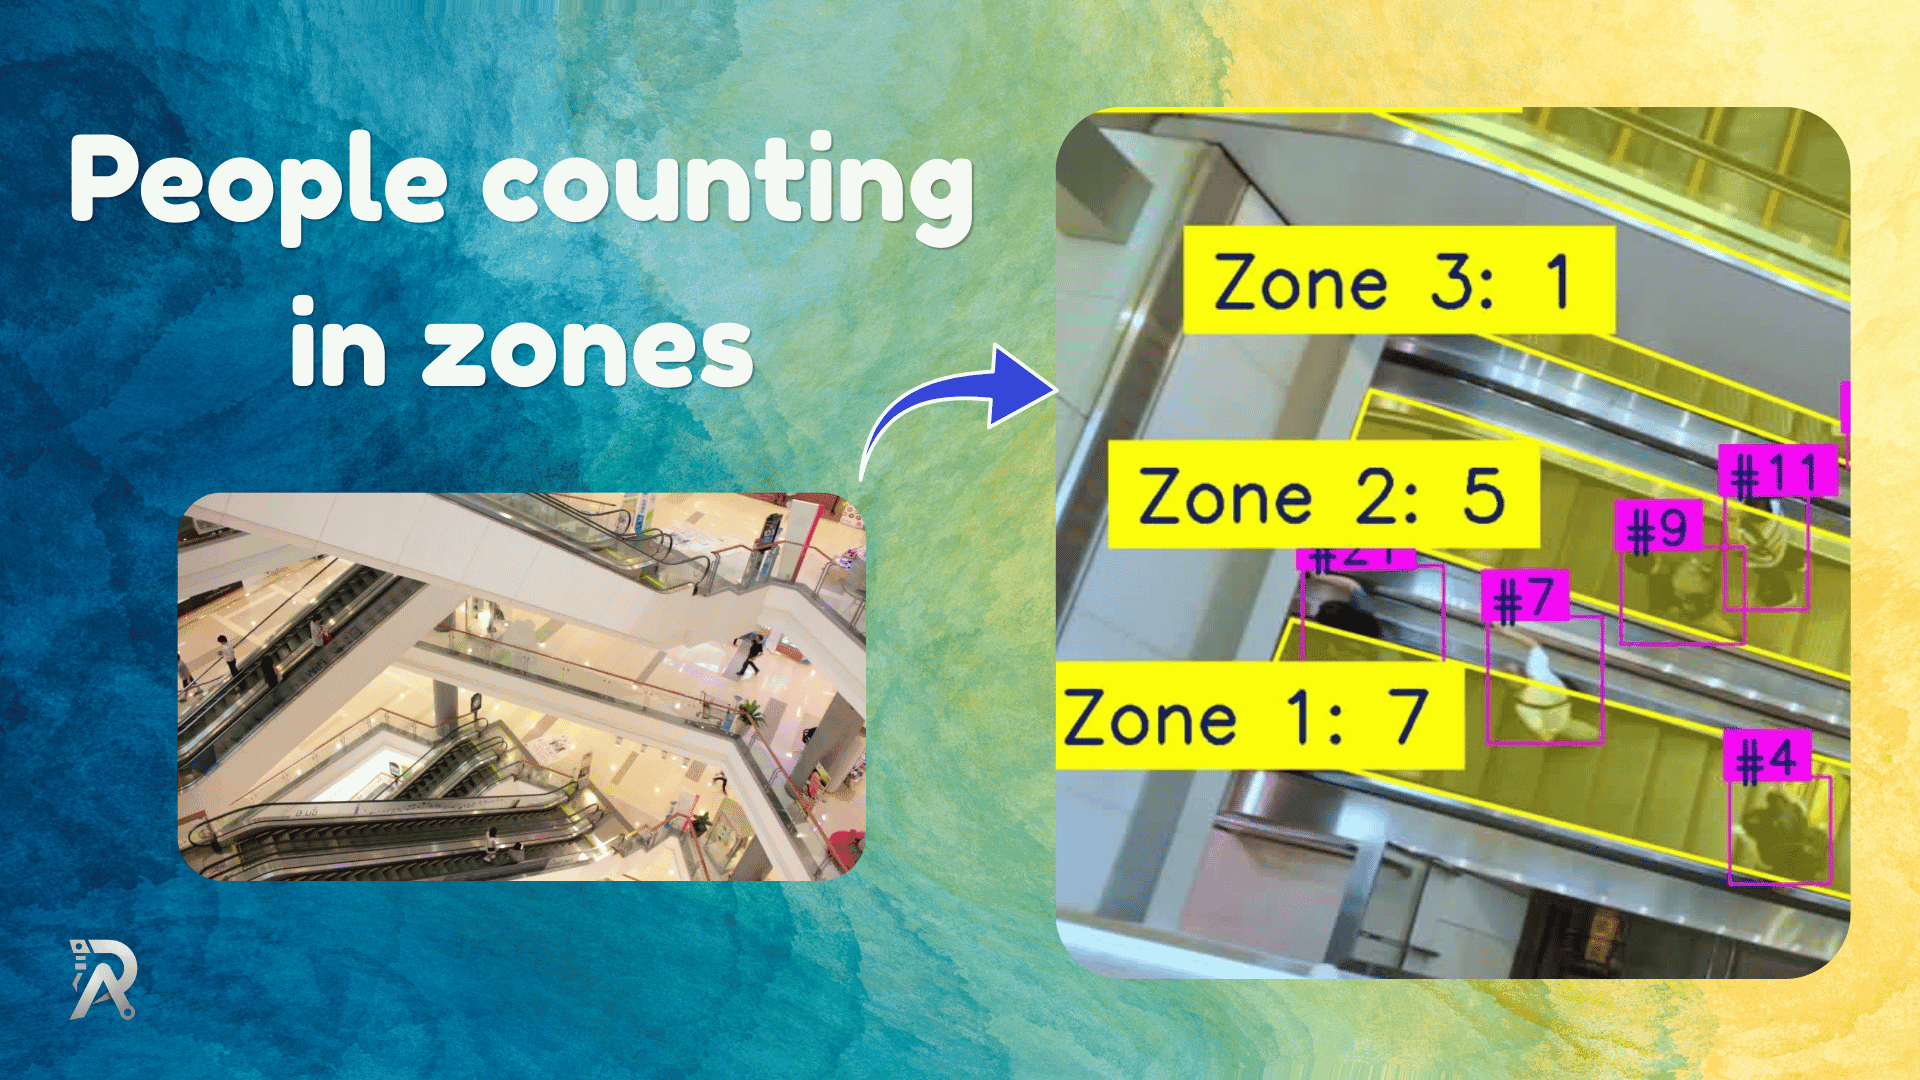
In this post, I'll walk through a compact, production-flavored Python script that does exactly that: it detects people with Ultralytics YOLO, tracks them across frames, and counts how many fall inside each of several polygon zones. It's around 250 lines, it runs on a video file or a webcam, and it writes out an annotated video. Let's pull it apart.
At a high level, every frame goes through four moves:
- Detect and track every person in the frame.
- Decide which zone each person is standing in.
- Tally the per-zone counts.
- Draw the zones, boxes, and labels, then write the frame out.
The clever bits aren't in the detection — YOLO handles that for you. They're in the geometry: defining zones as polygons, cleaning those polygons so they behave, and deciding which zone a person belongs to when zones overlap. That's where most homegrown counters quietly go wrong, so that's where we'll spend our time.
Defining the zones
Zones are just lists of [x, y] points — polygons drawn over the camera's field of view. The elevator example stacks five of them, roughly one per "row" of standing space:
POLYGONS = [
    # Zone # 01
    [[192, 818], [243, 832], [1209, 1078], [1596, 1076],
     [1601, 1047], [1524, 1029], [241, 694], [192, 815]],

    # Zone # 02
    [[274, 593], [336, 611], [1555, 978], [1627, 983],
     [1634, 874], [380, 478], [321, 461]],
    # ... three more
]
You'd normally generate these by pausing on a frame and clicking out the corners. They don't have to be rectangles — that's the whole point of using polygons. A real doorway or a slanted queue is rarely a tidy box.
The unglamorous hero: cleaning the polygons
Here's the part nobody warns you about. If you hand-click polygon points, you'll end up with two problems: near-duplicate points sitting almost on top of each other, and points in an order that makes the polygon's edges cross over themselves. Both of these quietly break OpenCV — a self-intersecting polygon fills wrong with fillPoly and gives nonsense results from pointPolygonTest.
The script fixes this once, up front:
@staticmethod
def _sanitize_polygon(points, min_dist=10):
    pts = np.array(points, dtype=np.float32)
    keep = []
    for p in pts:
        if not keep or np.linalg.norm(p - keep[-1]) > min_dist:
            keep.append(p)
    if len(keep) > 2 and np.linalg.norm(keep[0] - keep[-1]) <= min_dist:
        keep.pop()  # drop duplicated closing point
    pts = np.array(keep, dtype=np.float32)

    center = pts.mean(axis=0)
    angles = np.arctan2(pts[:, 1] - center[1], pts[:, 0] - center[0])
    return pts[np.argsort(angles)].astype(np.int32)
Two things happen here. First, it drops any point that sits within min_dist pixels of the previous one — that kills the duplicates. Second, and more importantly, it sorts the remaining points by their angle around the polygon's center. Sorting by angle guarantees the points go around the shape in order (clockwise or counter-clockwise), so the edges never cross. It's a small trick that turns messy hand-clicked coordinates into a well-behaved convex-ish polygon. If your zones are wildly concave, this re-ordering can over-simplify them, but for the rectangular-ish regions most counters use, it's exactly what you want.
Which zone is a person in?
Once the polygons are clean, deciding membership is a one-liner per zone, thanks to cv2.pointPolygonTest. But there's a subtlety: which point on a person do you test?
The script uses the bottom-center of the bounding box — ((x1 + x2) / 2, y2) — i.e., roughly where the feet are. That's the right call. If you tested the center of the box, a tall person leaning forward could "belong" to a zone whose feet are nowhere near. Feet-on-the-floor is how humans judge it, too.
def assign_zone(self, px, py):
    best, best_d = -1, -1.0
    for i, zone in enumerate(self.zones):
        d = cv2.pointPolygonTest(zone, (float(px), float(py)), True)
        if d >= 0 and d > best_d:
            best, best_d = i, d
    return best
Notice the second half. pointPolygonTest with True Returns the signed distance to the polygon edge — positive inside, negative outside. Instead of grabbing the first zone that returns positive, the code keeps the zone where the point is deepest inside. This is the tie-breaker for overlapping zones: a person standing where two zones touch gets assigned consistently to the one they're more firmly inside, frame after frame. That stability is what stops counts from flickering between neighbors.
And the counting step itself adds a small fallback — if the feet aren't inside any zone, it retries with the box center before giving up:
def count_zones(self, boxes):
    counts = [0] * len(self.zones)
    for (x1, y1, x2, y2, _) in boxes:
        zi = self.assign_zone((x1 + x2) / 2, y2)
        if zi < 0:
            zi = self.assign_zone((x1 + x2) / 2, (y1 + y2) / 2)
        if zi >= 0:
            counts[zi] += 1
    return counts
Detection and tracking
The detection layer is mercifully short because Ultralytics does the heavy lifting:
def detect_and_track(self, frame):
    results = self.model.track(frame, persist=True, conf=self.conf,
                               classes=self.classes, imgsz=self.imgsz,
                               device=self.device, verbose=False)
    boxes = []
    r = results[0]
    if r.boxes is not None:
        for b in r.boxes:
            x1, y1, x2, y2 = b.xyxy[0].tolist()
            track_id = int(b.id[0]) if b.id is not None else -1
            boxes.append((x1, y1, x2, y2, track_id))
    return boxes
The key argument is persist=Truethat it tells the tracker to carry identities across frames, so each person keeps the same identity #id. The script passes classes=[0] from main(), which restricts detection to the "person" class and ignores everything else. There's also an frame_skip option that runs detection only every Nth frame and reuses the last boxes in between — a cheap way to claw back FPS on slower hardware at the cost of a little tracking lag.
Drawing it back onto the video
Good visualization is half the value of a counter — you need to see that it's working. The drawing routine blends translucent fills for each zone first, then lays crisp outlines on top so they don't get muddied by the blend:
overlay = frame.copy()
for zone in self.zones:
    cv2.fillPoly(overlay, [zone], self.POLYS_COLOR)
img = cv2.addWeighted(overlay, self.FILL_ALPHA, frame, 1 - self.FILL_ALPHA, 0)

for zone in self.zones:
    cv2.polylines(img, [zone], True, self.POLYS_COLOR, 4, cv2.LINE_AA)
The order matters. Filling on a copy and then alpha-blending gives you see-through zones; drawing the outlines after the blend keeps the borders sharp. Each box gets a small #id tag, and each zone gets a Zone N: count label anchored to its first point. The label drawing even clamps its position to stay on-screen, so a zone near the frame edge doesn't get its number chopped off.
Running it
The pipeline ties together in process() and run(). process() handles one frame end-to-end; run() opens the video, loops, writes the annotated output, and shows a live window you can quit with q:
def process(self, frame):
    if self.frame_idx % self.frame_skip == 0:
        self.last_boxes = self.detect_and_track(frame)
    self.frame_idx += 1
    counts = self.count_zones(self.last_boxes)
    return counts, self.draw(frame, self.last_boxes, counts)
From the command line, it's just:
python zone_counter.py elevator.mp4
Pass a digit instead of a filename, and it treats it as a webcam index, so python zone_counter.py 0 runs off your default camera.
Where would you take it nex?t
This script is a clean foundation, and the obvious upgrades are easy to picture. You could log counts to a CSV with timestamps for later analysis, fire an alert when a zone exceeds a capacity threshold, or track entries and exits over time rather than just the live headcount. The polygon-cleaning and deepest-inside-wins logic would carry over unchanged — those are the genuinely reusable ideas here.
The real lesson isn't about elevators at all. It's that once you can reliably answer "is this point inside that shape, and if several shapes qualify, which one wins?", an enormous range of spatial-analytics problems becomes approachable. Queue monitoring, retail heatmaps, parking occupancy, crowd-safety dashboards — they're all variations on the same forty lines of geometry you just read.
Frequently asked questions
Do I need a GPU to run this? No. It runs on CPU, just slower. The device argument lets you point it at CUDA if you have it, and frame_skip helps recover speed on modest hardware.
Why polygons instead of simple rectangles? Because real-world regions are rarely axis-aligned boxes. Polygons let you trace a slanted doorway, a curved queue, or the trapezoidal floor rows of an elevator seen from an angled camera.
Why test the feet instead of the center of the person? Because a person occupies the floor at their feet. Testing the bounding-box center can place a leaning or partially occluded person in the wrong zone.
Can it count things other than people? Yes. The classes argument maps to YOLO's class list, so swap in the class IDs for cars, bikes, or anything the model knows, and the same zone logic applies.